Figure 2.

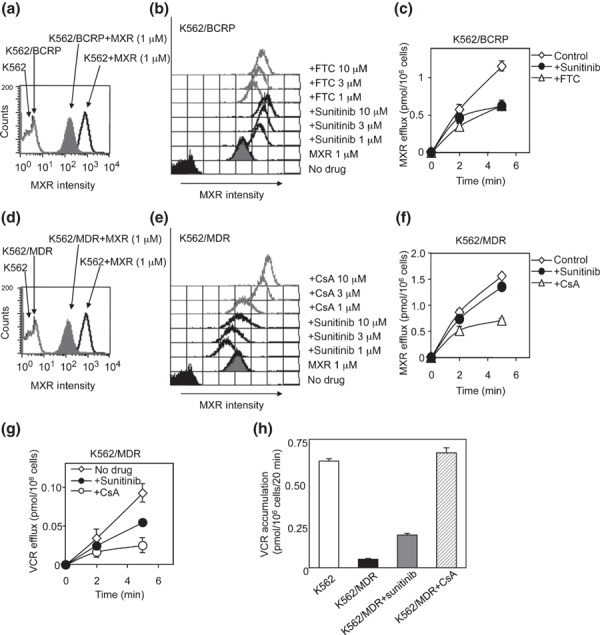
Effects of sunitinib on the uptake and efflux of mitoxantrone (MXR). Intracellular accumulation of MXR in K562 as a control, K562/breast cancer resistance protein (BCRP) (a) and K562/multidrug resistance protein (MDR) (d) cells was determined as the fluorescence intensity of MXR measured by flow cytometry. The histogram for MXR fluorescence intensity shows the intracellular accumulation level of MXR. The cellular uptake of MXR in the presence of sunitinib or fumitremorgin C (FTC) (b, gray lines) or cyclosporine A (CsA) (e, gray lines) in K562/BCRP (b, bold lines), and K562/MDR (e, bold lines) cells was measured as above. The fluorescence intensity patterns without MXR (control) are shown as filled histograms, and those without inhibitors as gray histograms. To measure the cellular efflux of MXR, K562/BCRP (c) and K562/MDR (f) cells were pre‐treated with 200 nmol/L of 3H‐labeled MXR for 30 min and then incubated in fresh growth medium without 3H‐labeled MXR. The efflux of 3H‐labeled MXR was determined by measuring the level of radioactivity exported into the culture medium. The time‐dependent efflux of MXR in the absence of inhibitors is shown as open diamond symbols (c,f). The effects of sunitinib (filled circles), FTC (c, open triangles), and cyclosporine A (CsA) (f, open triangles) on MXR efflux were determined. Results are means ± SD of triplicate determinations. (g) To measure cellular efflux of VCR, K562/MDR cells were pre‐treated with 100 nmol/L of 3H‐labeled VCR for 30 min and then incubated in fresh growth medium without 3H‐labeled VCR. The efflux of 3H‐labeled VCR was determined as above. The time‐dependent efflux of VCR in the presence of sunitinib (filled circles), CsA (open circles) or absence of inhibitor (open diamond symbols) is shown. (h) Cellular uptake of VCR in K562/MDR cells was determined in the absence or presence of 10 μmol/L of inhibitors. The accumulation of VCR is shown for parental K562 (white column), K562/MDR (black column), K562/MDR cells with sunitinib (gray column), and K562/MDR cells with CsA (hatched column). Results are means ± SD of triplicate determinations.
