
Figure 1.
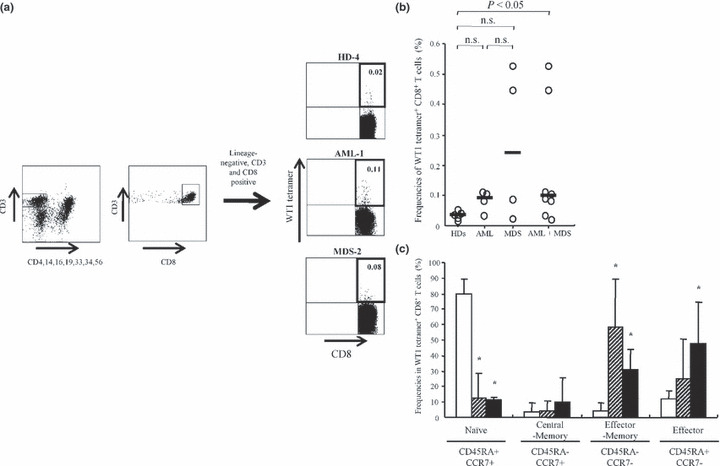
Increase in WT1 (Wilms’ tumor gene 1) tetramer+ CD8+ T cells with more maturated phenotypes in patients. (a) Representative profiles of flow cytometric analysis using WT1 tetramer. The numbers at the upper‐right corners in dot plots of lineage antigens CD4, 14, 16, 19, 33, 34 and 56‐negative and CD3‐, CD8‐positive gate represent the ratio of WT1 tetramer+ CD8+ T cells to total CD8+ T cells. (b) Ratios of WT1 tetramer+ CD8+ T cells to total CD8+ T cells in peripheral blood mononuclear cells (PBMC)s of healthy donors (HDs) (n = 5) and acute myeloid leukemia (AML) (n = 4), and myelodysplastic syndrome (MDS) (n = 4) patients. Bars represent medians; n.s., not significant. (c) Frequencies of four differentiation subsets of WT1 tetramer+ CD8+ T cells. White, hatched and black columns represent HDs, AML, and MDS patients, respectively. Statistical significance between HDs and AML, and HDs and MDS is indicated by asterisks (*P < 0.05).