
Figure 7.
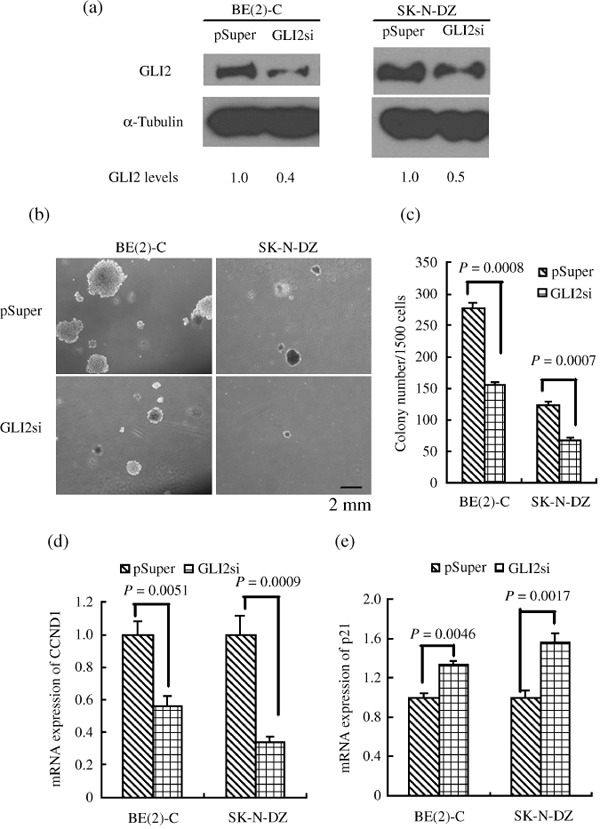
Knockdown of GLI2 inhibited colony growth of neuroblastoma (NB) cell lines in soft agar. (a) Immunoblot analysis of GLI2 expression levels in the indicated NB cell lines. Forty to 50% reduction of GLI2 levels was obtained. α‐Tubulin levels are shown as the loading control. (b) Phase contrast images of the colony growth of the indicated NB cell lines in soft agar after culture for 14 to 21 days. (c) Numbers of colonies per 1500 plating cells after 14 to 21 day culture. Colonies that contained more than 50 cells or were larger than 0.5 mm were scored. (d) Relative mRNA levels of CCND1 as determined by RT‐PCR in NB GLI2 knockdown cells. (e) Relative mRNA levels of p21 as determined by RT‐PCR in NB GLI2 knockdown cells. Each bar represents the average ± SD of three independent experiments. Statistical analysis was performed using the two‐tailed Student's t‐test. Scale bar, 2 mm.