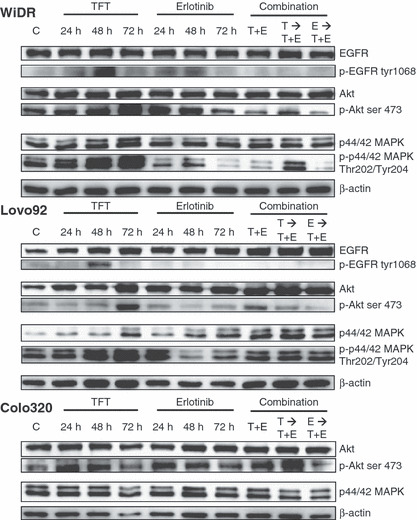
Figure 6.

Western blot of expression levels of intracellular kinases after 24, 48, and 72 h exposure to trifluorothymidine (TFT) alone, erlotinib (E) alone, or in three combination schedules (72 h). The blots are representative of three independent experiments. Colo320 cells did not express detectable epidermal growth factor receptor (EGFR), phosphorylated (p‐)EGFR, or phosphorylated MAPK (Fig. 5), so blots have not been included in this figure. C, control; E → T + E, cells preincubated with E, followed by T + E combination; T → T + E, cells preincubated with TFT, followed by T + E combination; T + E, simultaneous combination of TFT and E.
