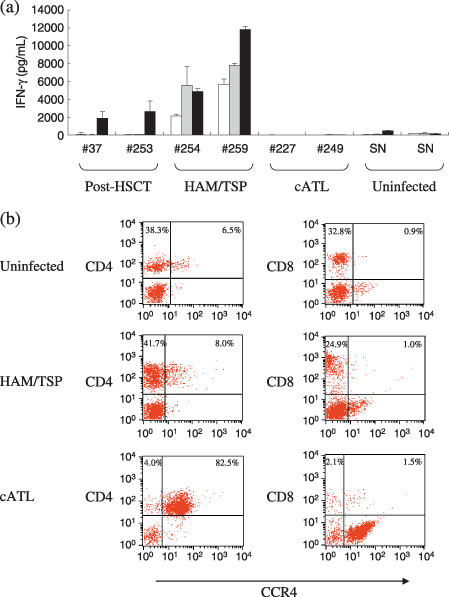
Figure 1.

Different patterns of Tax‐specific T‐cell responses in various diseases associated with human T‐cell leukemia virus type‐1 (HTLV‐1) infection. (a) Peripheral blood mononuclear cells (PBMCs) (2.0 × 10⁵ cells/well) from two post‐hematopoietic stem cell transplantation (HSCT) adult T‐cell leukemia (ATL) patients in long‐term remission (#37, #253), two HTLV‐1‐associated myelopathy/tropical spastic paraparesis (HAM/TSP) patients (#254, #259), two chronic‐type ATL (cATL) patients (#227, #249), and two seronegative uninfected subjects (SN) were cultured alone (open bars), with glutathione‐S‐transferase (GST) (gray bars) or with a mixture of GST–Tax proteins (black bars) in a total volume of 200 µL of medium/well for 4 days. Interferon (IFN)‐γ in the supernatants was measured by enzyme‐linked immunoabsorbent assay. The results represent the mean ± SD of duplicate wells. (b) Uncultured PBMCs from an uninfected subject, a HAM/TSP patient (#255), and a cATL patient (#227) were stained with carboxyfluorescein‐conjugated CCR4 monoclonal antibody (mAb) together with phycoerythrin (PE)‐Cy5‐labeled CD4 (left) or CD8 (right) mAbs. Values indicate the percentages of positive cells in each quadrant analyzed by flow cytometry for a total of 10 000 gated lymphocytes.
