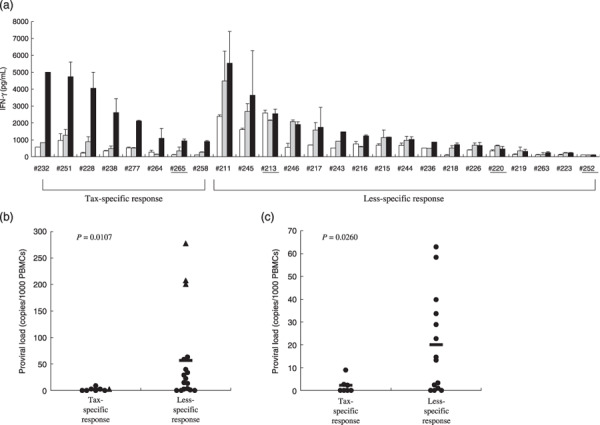
Figure 2.

Diversity in Tax‐specific T‐cell responses among asymptomatic human T‐cell leukemia virus type‐1 (HTLV‐1) carriers (ACs) and smoldering‐type adult T‐cell leukemia (sATL) patients. (a) Peripheral blood mononuclear cells (PBMCs) isolated from 21 ACs and 4 sATL patients (underline) were incubated alone (open bars), with glutathione‐S‐transferase (GST) (gray bars) or with a mixture of GST–Tax proteins (black bars) for 4 days, and interferon (IFN)‐γ amounts in the supernatants were measured by enzyme‐linked immunoabsorbent assay and a Cytokine Beads Assay in part. The results were divided into Tax‐specific or less‐specific response groups depending on the ratios of anti‐GST–Tax/anti‐GST IFN‐γ production were more than 2.5 or not, and then aligned in the order of absolute values of IFN‐γ production against GST–Tax proteins in each group. (b, c) HTLV‐1 proviral loads of all the ACs and sATL patients tested (b) or ACs alone (c) were indicated. The mean values of proviral loads (bars) in Tax‐specific and less‐specific response groups were 2.0 and 56.9 copies/1000 PBMCs, respectively (P = 0.0107) in (b), and 1.9 and 20.1 copies/1000 PBMCs, respectively (P = 0.0260) in (c). AC, closed circle; sATL: closed triangle.
