
Figure 2.
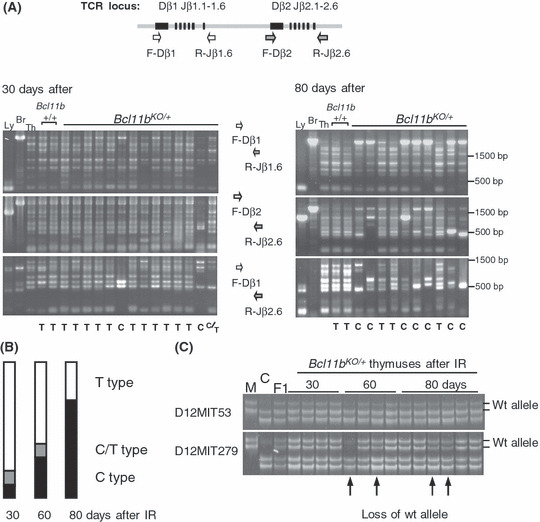
Clonal growth of thymocytes in thymuses after γ‐irradiation of 8‐week‐old Bcl11b KO/+ mice. (A) D‐J rearrangement patterns at the T cell receptor β‐chain (TCRβ) locus in thymuses at 30 and 80 days after irradiation. The upper diagram shows part of the TCRβ locus and the relative location of PCR primers used. The lower panel shows gel electrophoresis of PCR products with three different sets of primers, F‐Dβ1 and R‐Jβ1.6 (top), F‐Dβ2 and to‐Jβ2.6 (middle), and F‐Dβ1 and R‐Jβ2.6 (bottom). T below the panel indicates T‐type thymus that shows identical or similar rearrangement patterns to the control thymus, and C indicates C‐type thymus that shows a few bands more prominent than the other bands or limited numbers of bands. C/T indicates C/T‐type thymus between the T‐type and C‐type patterns. Size markers are shown at right. (B) Incidences of C‐ (black box), C/T‐ (gray box) and T‐type (white box) thymuses in 30, 60, and 80 days after γ‐irradiation in Bcl11b KO/+ mice. (C) Allelic losses at the Bcl11b locus in irradiated thymuses. Two panels show polyacrylamide gel electrophoresis for PCR products of D12Mit53 and D12Mit279 primer pairs. Chromosomal location of D12Mit53, Bcl11b, and D12Mit279 is 108.69, 109.15–24, 109.69 Mb from the centromere, respectively. We determined the allele ratio of BALB/c and MSM bands and judged the thymus as allelic loss‐positive when the allele ratio was more than 2 or less than 0.5.