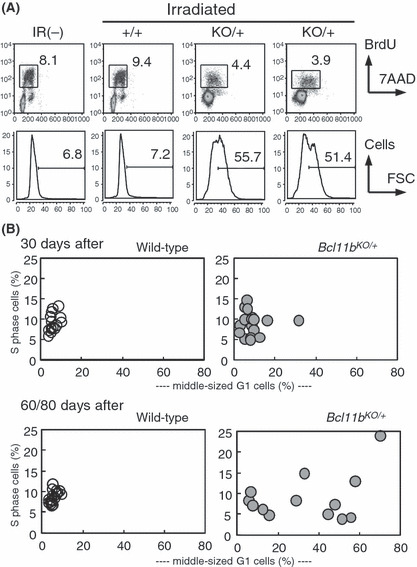
Figure 3.

Cell proliferation and cell size. (A) Flow cytometry of cell cycle in unirradiated and irradiated thymuses. (upper) The vertical axis shows BrdU incorporation levels and the horizontal axis displays 7‐AAD staining for DNA contents. A square marks a fraction of thymocytes in the S‐phase, and the number gives the percentage of S‐phase cells. (lower) The vertical axis shows the cell number and the horizontal axis displays forward scatter (FSC) values reflecting the cell size in G1‐phase thymocytes. The bar shows a fraction of thymocytes in large size (middle‐sized G1 cells) and the number above the bar indicates the percent of those thymocytes. The percentage was determined in each thymus by the criterion where the percentage in normal thymus was set to approximately 5% of the FSC value. (B) The vertical axis shows the percentage of S‐phase cells and the horizontal axis displays the percentage of middle‐sized G1 cells. Thirty‐day thymuses, upper; groups of 60‐ and 80‐day thymuses, lower; Bcl11b +/+ thymuses, left; Bcl11b KO/+ thymuses, right.
