Figure 4.

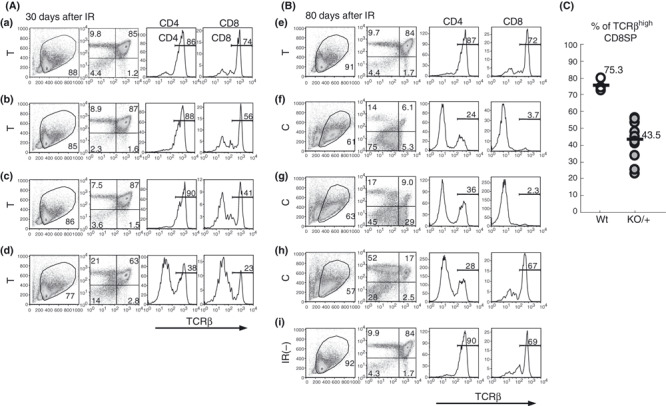
Flow cytometry of CD4, CD8, and T cell receptor β‐chain (TCRβ) expression on thymocytes. Thymocytes at 30 days (A) and 80 days (B) after irradiation. (from left to right) The vertical axis shows side scatter (SSC) values and the horizontal axis displays forward scatter (FSC) values (the gated region marked by a circle); the vertical axis shows CD4 expression and the horizontal axis displays CD8 expression; the vertical axis shows cell number and the horizontal axis displays TCRβ expression of thymocytes in the CD4 quadrant; the vertical axis shows cell number and the horizontal axis displays TCRβ expression of thymocytes in the CD8 quadrant. (a) in (A) is a thymus in irradiated Bcl11b +/+ mice and (b–d) are thymuses in irradiated Bcl11b KO/+ mice. All four thymuses are T type. (e–h) in (B) are irradiated Bcl11b KO/+ mice and (i) is an unirradiated Bcl11b KO/+ mice. (e) is T‐type and (f–h) are C‐type thymuses. (C) The percentage of TCRβhigh CD8SP thymocytes in Bcl11b +/+ (75.3%) and Bcl11b KO/+ (43.5%) mice.
