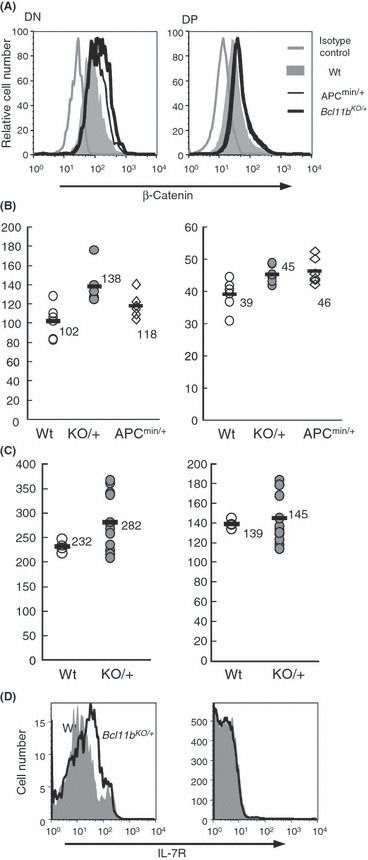
Figure 6.

Flow cytometry of β‐catenin and interleukin‐7 receptor (IL‐7R) expression. (A) β‐catenin expression in double‐negative (DN) and double‐postive (DP) cells of Bcl11b +/+ (gray region), Bcl11b KO/+ (bold black line), and Apc min/+ (thin black line) mouse thymocytes. DN cells, left; DP cells, right. Isotype‐matched staining control for Bcl11b +/+ thymocytes is shown for comparison (gray line). The vertical axis shows relative cell number and the horizontal axis displays β‐catenin expression. (B) The mean fluorescence intensity of β‐catenin is compared between thymocytes of the three different genotypes. P‐values in DN and DP cells between Bcl11b +/+ and Bcl11b KO/+ mice were 0.0034 and 0.019, respectively. The P‐value in DP cells between wild‐type and Apc min/+ mice was 0.017. Comparison of the percent of β‐catenin‐positive cells showed similar results (not shown). (C) Mean fluorescence intensity of β‐catenin in thymocytes compared between wild‐type (gray circles) and Bcl11b KO/+ (closed black circles) mice at 30 days after irradiation. (D) IL‐7R expression in DN and DP cells of wild‐type (gray region) and Bcl11b KO/+ (black line) mouse thymocytes.
