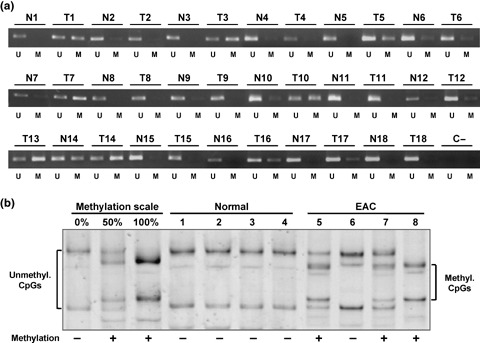
Figure 2.

Methylation analysis of the Wnt inhibitory factor‐1 (WIF‐1) promoter in esophageal adenocarcinoma (EAC) tissue samples. (a) Methylation‐specific polymerase chain reaction analysis of 17 matched pairs of frozen normal (N) and EAC (T) tissue samples and of one unpaired EAC sample (T13). Bands (198 bp) in lanes labeled “U” are unmethylated DNA product amplified with unmethylation‐specific primers. Bands in lanes labeled “M” are methylated DNA product amplified with methylation‐specific primers. (b) WIF‐1 promoter methylation by methylation‐sensitive single‐strand conformation analysis in four microdissected formalin‐fixed paraffin‐embedded normal squamous epithelia and four EAC samples. Square brackets indicate the migration of either the umethylated DNA (unmethyl. CpGs) or the methylated DNA (methyl. CpGs). + and – indicate the methylation status of each sample.
