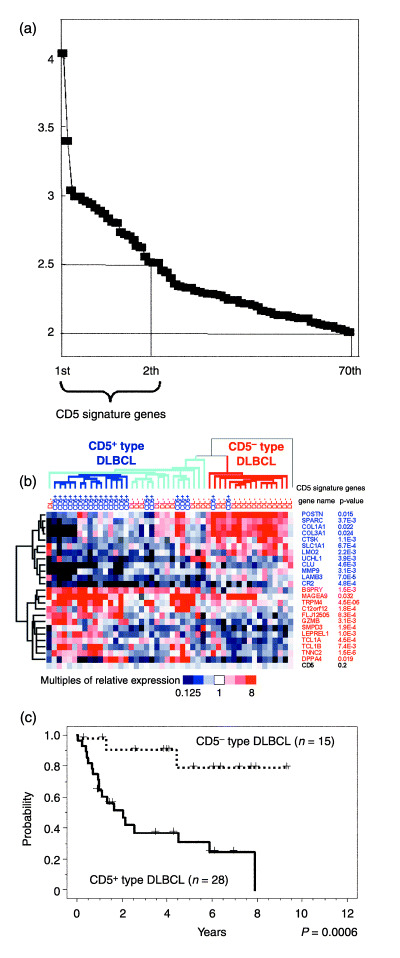
Figure 1.

CD5 signature genes define CD5+‐type and CD5−‐type diffuse large B‐cell lymphoma (DLBCL). (a) Differences in the expression of CD5 signature genes. Genes showing the highest level of differential expression between 22 CD5+ and 26 CD5− DLBCL cases are aligned, and multiples of the average differences in their expression levels are shown on the vertical axis. Twenty‐four genes showing an average difference of more than 2.5‐fold between the subgroups were designated as the CD5 signature genes. Seventy genes in total showed a difference of more than 2.0‐fold. (b) Hierarchical clustering of 48 DLBCL cases via the expression levels of the 24 CD5 signature genes. Each row represents one gene. The dendrogram on the left shows the degree to which each gene is related to the others. Half of the CD5 signature genes in CD5+ DLBCL showed low expression levels (upper portion of the figure, shown in blue), some of which were related to the extracellular matrix (POSTN, SPARC, COL1A1, COL3A1, CTSK, MMP9 and LAMB3). The remaining CD5 signature genes in CD5+ DLBCL showed high expression (lower portion of the figure, shown in red). The relative expression of CD5 for each sample is indicated at the bottom of the figure, which also shows the P‐values of these genes, determined using the Student's t‐test. Each column represents one DLBCL case and the dendrogram on the top shows the degree to which each DLBCL is related to the other tumor samples in terms of gene expression. The DLBCL cases were divided into two subgroups: CD5+‐type (left) and CD5−‐type DLBCL (right). There was a cluster of 15 CD5+ DLBCL cases at the core of the CD5+‐type DLBCL group (marked with dark blue lines). One CD5− DLBCL case, located in a row on the extreme right, belonged to neither of the subgroups. (c) Kaplan–Meier analysis of the CD5+‐type and the CD5−‐type DLBCL cases in this study. The CD5+‐type DLBCL patients showed a significantly poorer prognosis than their CD5−‐type DLBCL counterparts. The P‐values for these subgroups were analyzed using the log‐rank test.
