
Figure 2.
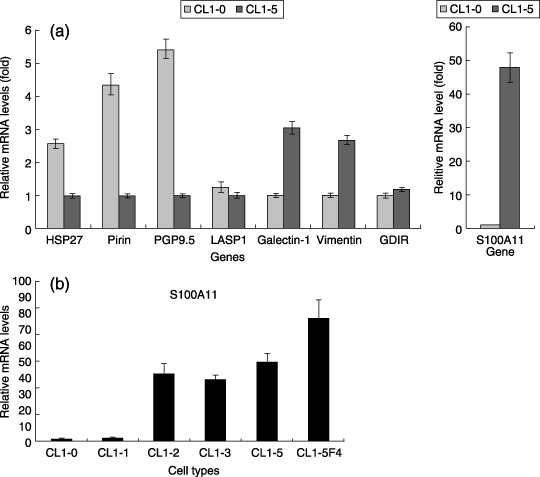
Real‐time quantitative polymerase chain reaction analysis of some candidate genes. (a) Relative mRNA expression ratios of HSP27, pirin, PGP9.5, LASP1, galectin‐1, vimentin, GDIR and S100A11 mRNA expression in non‐metastatic CL1‐0 and highly metastatic CL1‐5. β‐Actin was used as an internal control. The histogram of the S100A11 gene is illustrated separately because of the large difference in both cell lines. (b) Relative mRNA expression levels of S100A11 in serial metastatic cells CL1‐0, CL1‐1, CL1‐2, CL1‐3, CL1‐5 and CL1‐5F4. β‐Actin was used as an internal control. The data are shown as means of three independent experiments ± SD.