
Figure 4.
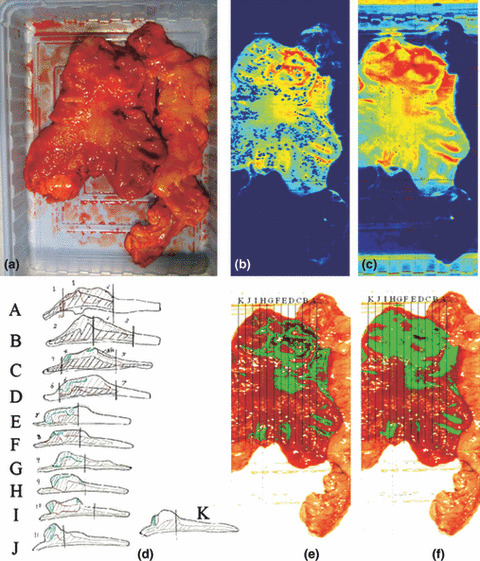
Cancer detection using the normalized cancer index (NDCI) and integral filter and comparison with pathological results. (a) the RGB image; (b) the cancer enhanced regions using integral filter in the hyperspectral image (1057–2440 nm), the tissues are shown in a blue to red spectrum and the red regions represent the tumor; (c) the cancer enhanced regions using NDCI; (d) pathological results; (e) detected tumor using integral filter (f) detected tumor using NDCI.