
Figure 4.
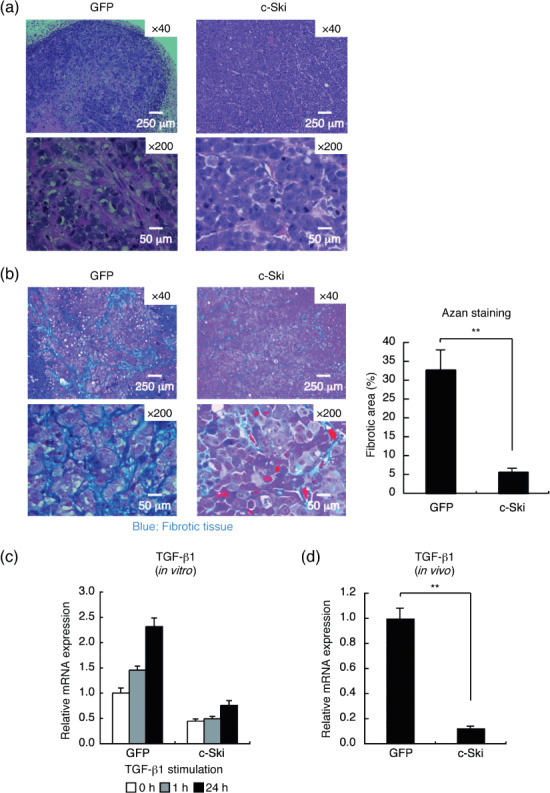
Histological changes in OCUM‐2MLN tumors induced by c‐Ski expression. (a) H&E staining of tissue sections of 2MLN‐green fluorescent protein (GFP) (left) and 2MLN‐c‐Ski (right) tumors at day 28. Representative images are shown. Scale bars = 250 µm in upper panels and 50 µm in lower panels. (b) Fibrotic areas of 2MLN‐GFP (left) and 2MLN‐c‐Ski (right) tumors were determined by AZAN staining of sections of subcutaneous tumors. Representative images are shown in the left panels. Scale bars = 250 µm in upper panels and 50 µm in lower panels. Percentage fibrotic area is shown in the right panel. Results are the mean of quantification of five fields (**P < 0.01). (c) Effects of c‐Ski on the transcription of transforming growth factor (TGF)‐β1 in vitro (left). 2MLN‐GFP and 2MLN‐c‐Ski cells were treated with TGF‐β1 (1 ng/mL), and expression of TGF‐β1 was examined by quantitative real‐time RT‐PCR analysis at the indicated time points (left). (d) Expression of TGF‐β1 in OCUM‐2MLN subcutaneous tumors. Total RNA was extracted from subcutaneous tumors, and expression of human TGF‐β1 was examined by quantitative real‐time RT‐PCR analysis. Results represent the mean of triplicate determination (**P < 0.01).