
Figure 2.
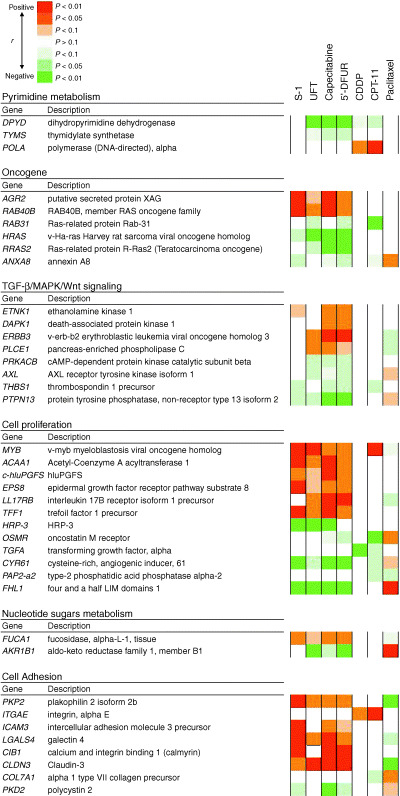
Correlation between drug sensitivity and the expression profiles of 39 genes that were significantly correlated with multidrug sensitivity, and classified into key pathways. Red, a positive correlation; green, a negative correlation.
Official websites use .gov
A
.gov website belongs to an official
government organization in the United States.
Secure .gov websites use HTTPS
A lock (
) or https:// means you've safely
connected to the .gov website. Share sensitive
information only on official, secure websites.
Correlation between drug sensitivity and the expression profiles of 39 genes that were significantly correlated with multidrug sensitivity, and classified into key pathways. Red, a positive correlation; green, a negative correlation.