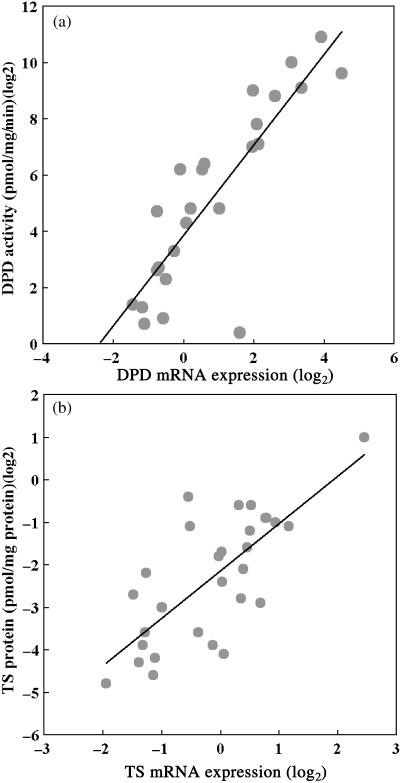
Figure 4.

Correlation between mRNA expression and protein level. Scatter plots of protein expression levels against mRNA expression levels obtained by GeneChip system. Each symbol represents a xenograft. The Pearson correlation coefficients (r) and P value (P) are shown.
