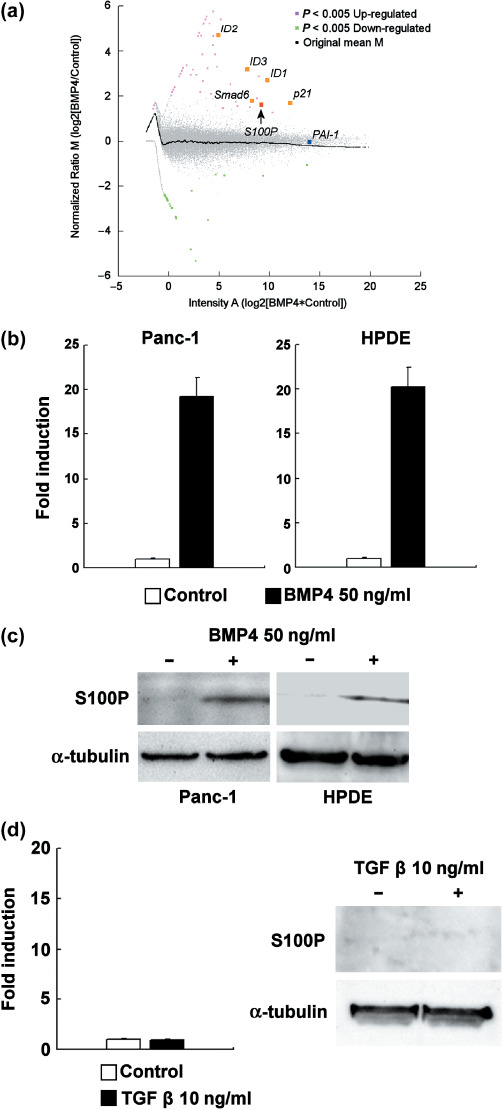
Figure 1.

Bone morphogenetic protein (BMP) target gene induction in Panc‐1 cells. (a) The MA‐plot of microarray analysis in Panc‐1 cells. Red spots are significantly upregulated genes and green spots are significantly downregulated genes. Gray spots are unchanged genes. Cells were treated with 50 ng/mL BMP4 or vehicle for 24 h. (b) The real‐time reverse transcription–polymerase chain reaction (RT‐PCR) analysis of S100P induction in BMP4‐treated (50 ng/mL, 24 h) Panc‐1 and HPDE cells (n = 3). The expression level of S100P was normalized by the glyceraldehyde‐3‐phosphate dehydrogenase gene expression level, and the fold of induction was calculated by setting the control‐treated sample as 1. Error bars indicate SE. (c) Western blotting analysis of S100P induction in BMP4‐treated (50 ng/mL, 48 h) Panc‐1 and HPDE cells. α‐Tubulin is displayed as loading control. (d) Real‐time RT‐PCR analysis (n = 3, error bars indicate SE) and western blotting analysis of S100P induction in transforming growth factor (TGF)‐β‐treated (10 ng/mL, 24 h for RT‐PCR, 48 h for western blotting) Panc‐1 cells.
