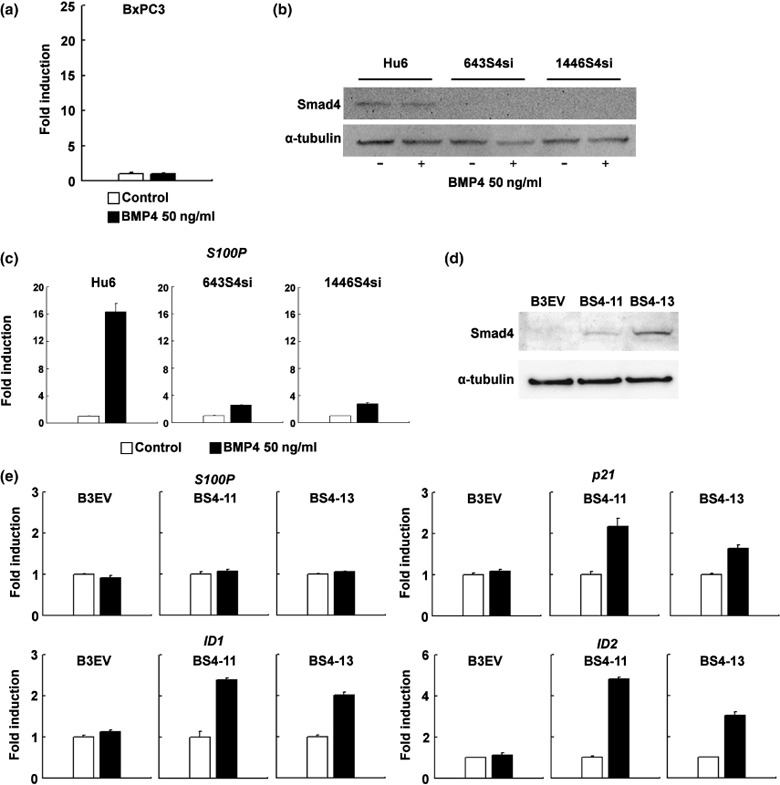
Figure 4.

S100P induction by bone morphogenetic protein (BMP)‐4 in Smad4‐null or Smad4‐knockdown cell lines. (a) Real‐time reverse transcription–polymerase chain reaction (RT‐PCR) analysis of S100P induction in the Smad4‐null cell line BxPC3 (n = 3, 50 ng/mL BMP4, 24 h). The expression level of S100P was normalized by the glyceraldehyde‐3‐phosphate dehydrogenase gene expression level, and the fold of induction was calculated by setting the control‐treated sample as 1. Error bars indicate SE. (b) Western blotting analysis of Smad4 expression in Hu6, 643S4si, and 1446S4si cell lines with or without BMP4 treatment (50 ng/mL, 48 h). α‐Tubulin is displayed as a loading control. (c) Real‐time RT‐PCR analysis of S100P induction by BMP4 in Hu6 and Smad4‐knockdown cell lines (n = 3, 50 ng/mL BMP4, 24 h). Error bars indicate SE. (d) Western blotting analysis of Smad4 expression in B3EV, BS4‐11, and BS4‐13 cell lines. α‐Tubulin is displayed as a loading control. (e) Real‐time RT‐PCR analysis of S100P, ID1, ID2, and p21 induction by BMP4 in B3EV, BS4‐11, and BS4‐13 cell lines (n = 3, 50 ng/mL BMP4, 24 h). Error bars indicate SE.
