
Figure 2.
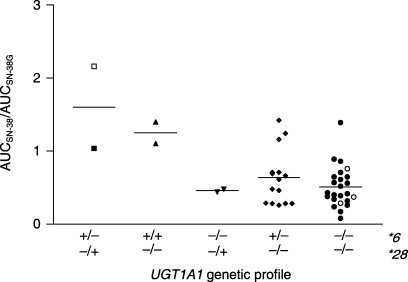
Ratio of the area under the plasma concentration–time curve (AUC) for SN‐38 to the AUC for SN‐38 glucuronide (SN‐38G), used as a surrogate for UGT1A1 activity (AUCSN‐38/AUCSN‐38G). Results are shown according to UGT1A1 genetic profile for 45 Japanese patients who received various regimens of irinotecan chemotherapy. Open symbols in the figure represent the patients suffering from grade 4 neutropenia. Lines indicate median values. One patient was excluded because of an incomplete set of blood samples.