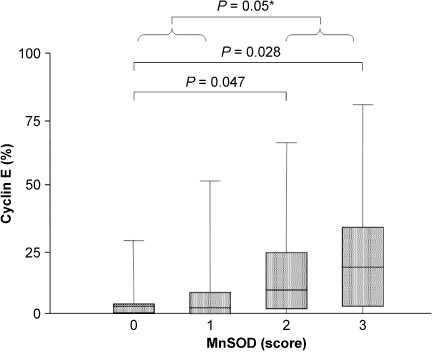
Figure 2.

Box‐plot of cyclin E expression levels in breast cancers stratified according to manganese superoxide dismutase (MnSOD) staining intensity. For each group, the bottom and top edges of the box are the 25th and 75th percentiles and the bottom and top parts of the external lines are 2.5th and 97.5th percentiles, respectively. Median values are shown by the lines within the boxes. *Group 0/1 versus 2/3.
