
Figure 3.
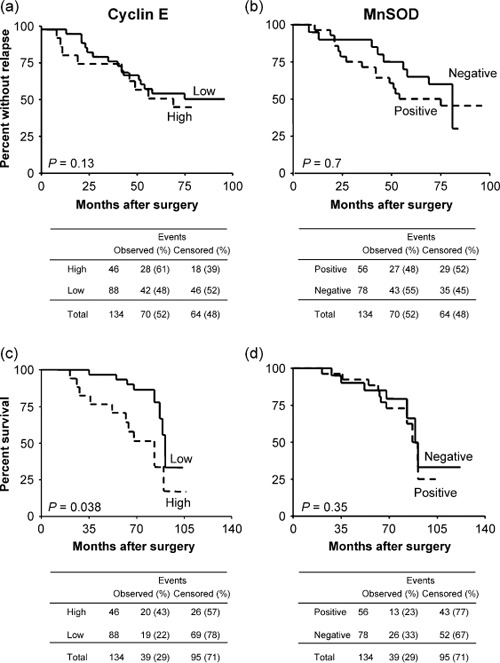
Kaplan–Meier curves for (a,b) disease‐free and (c,d) overall survival in 134 breast cancer patients stratified according to (a,c) cyclin E and (b,d) manganese superoxide dismutase (MnSOD) expression.
Official websites use .gov
A
.gov website belongs to an official
government organization in the United States.
Secure .gov websites use HTTPS
A lock (
) or https:// means you've safely
connected to the .gov website. Share sensitive
information only on official, secure websites.
Kaplan–Meier curves for (a,b) disease‐free and (c,d) overall survival in 134 breast cancer patients stratified according to (a,c) cyclin E and (b,d) manganese superoxide dismutase (MnSOD) expression.