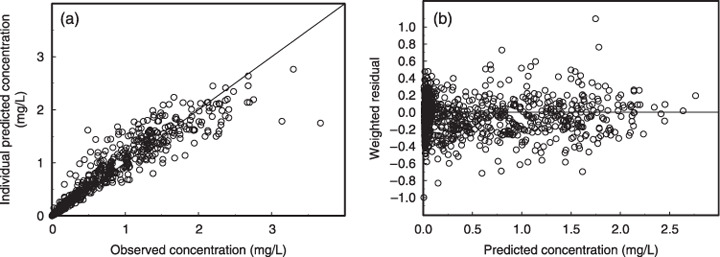
Figure 2.

(a) Observed docetaxel concentration versus predicted docetaxel concentration from a Bayesian post hoc analysis of the model. The solid line represents the unit line. (b) Weighted residuals versus predicted concentration. The horizontal line represents the zero level.
