
Figure 3.
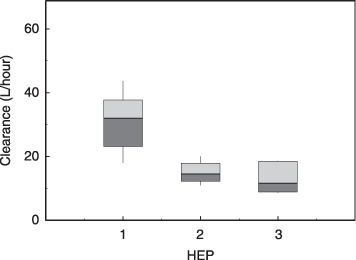
Box plot of estimated systemic clearance of docetaxel according to hepatic function calculated by Bayesian estimation. The top, middle, and bottom lines of each box correspond to the 75% (top quartile), 50% (median), and 25% (bottom quartile) values. The whiskers show the range values that fall between 10 and 90%. 1, 2, and 3 HEP denote normal (n = 183), mildly (increased alkaline phosphatase [ALP] in combination with grade 2 elevation of aspartate aminotransferase [AST] or alanine aminotransferase [ALT], n = 10), and moderately elevated liver function tests (increased ALP in combination with grade 3 or greater elevation of AST or ALT, n = 7), respectively.