
Figure 2.
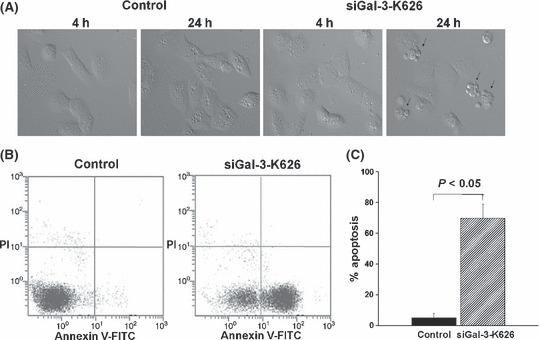
Induction of apoptosis in cholangiocarcinoma (CCA) cell lines treated with siGal‐3‐K626. (A) Cell morphology of control and siGal‐3‐K626‐treated cells was observed by time‐lapse microscopy at 4 h and 24 h after transfection. (B) Apoptotic cells were detected in siGal‐3‐K626‐treated cells using Annexin V and PI (propidium iodide) staining followed by flow cytometry. (C) The percentages of apoptotic cells were compared between siGal‐3‐K626‐treated cells and controls. Results are the mean ± SE of three independent experiments.