
Figure 1.
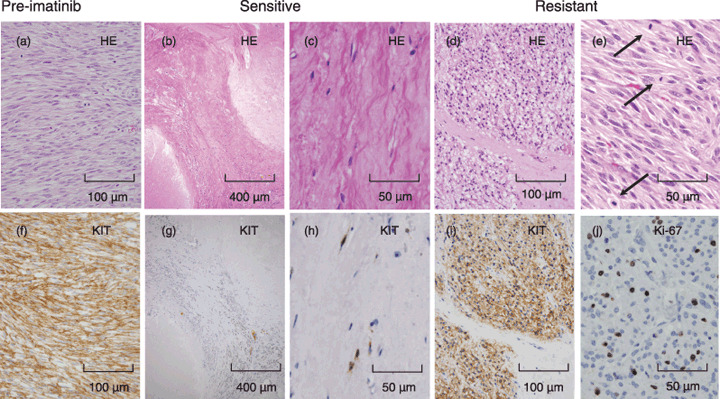
Pathological findings of pre‐imatinib, imatinib‐sensitive, and imatinib‐resistant lesions. Representatives of pre‐imatinib (a and f), imatinib‐sensitive (b, c, g, and h), and imatinib‐resistant (d, e, i and j) lesions are shown. Upper panels (a–e) show hematoxylin–eosin (HE) staining and lower panels show immunohistochemistry ([f–i], KIT; [j], Ki‐67 antigen). Arrows in (e) indicate mitotic figures. Imatinib‐sensitive lesions show a few KIT‐positive spindle cells in a background of hyaline degeneration. Imatinib‐resistant lesions show a lump of KIT‐positive spindle tumor cells that contains many mitotic figures and Ki‐67‐potitive cells.