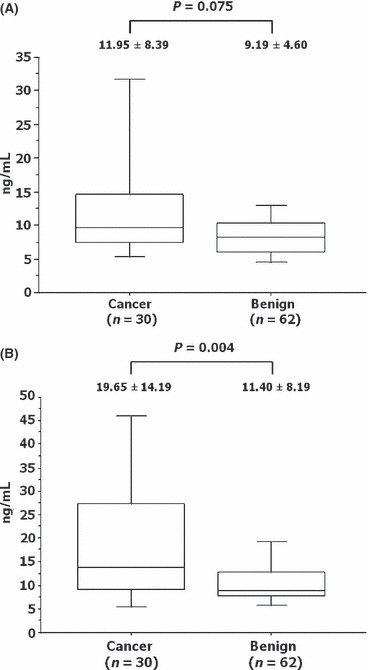
Figure 2.

Association between the final pathological results and the serum prostate‐specific antigen level at the first (A) and repeat (B) biopsies of the prostate. Boxed areas represent the 25th and 75th percentiles, and error values; error bars represent the 10th and 90th percentiles.
