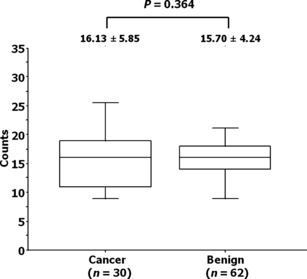
Figure 3.

Association between the tumor‐associated macrophage count and pathological results in patients who underwent repeat biopsies of the prostate. Boxed areas represent the 25th and 75th percentiles, and error values; error bars represent the 10th and 90th percentiles.
