
Figure 3.
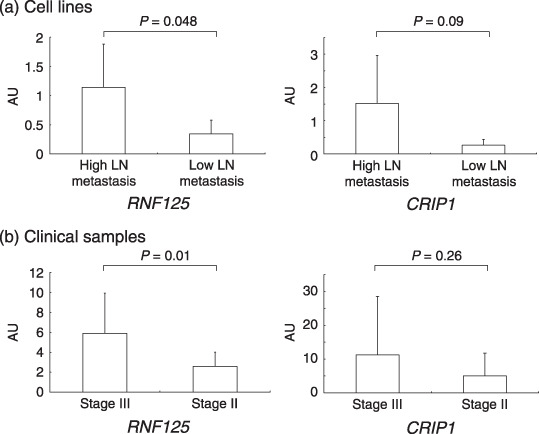
Semiquantitative reverse transcription–polymerase chain reaction analysis of RNF125 and CRIP1 mRNA expression levels in cell lines (a) and clinical samples (b) obtained from stage II and stage III patients. The relative expression levels of RNF125 or CRIP1 were defined by mRNA expression levels of ring finger protein 125 (RNF125) or cysteine‐rich intestinal protein 1 (CRIP1)/mRNA expression level of glyceraldehyde‐3‐phosphate dehydrogenase (GAPDH) ratio, represented as arbitrary units (AU). All data are the mean ± SD of values analyzed in triplicate using cDNA of cell lines or duplicate using cDNA of clinical samples.