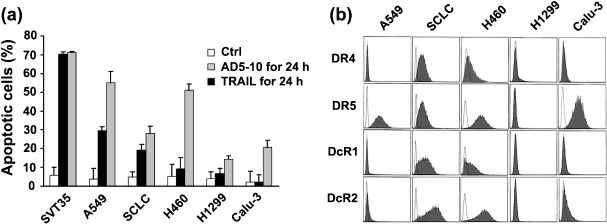
Figure 1.

Sensitivity of lung cancer cells to AD5‐10‐induced apoptosis. (a) Cytotoxicities of equimolar AD5‐10 and TRAIL on A549, SCLC, H460, H1299, and Calu‐3 cell lines. Percentages represent the sum of Annexin V‐positive and Annexin V/PI double‐positive cells. SVT35 Jurkat T cell line was used as positive control. Columns, mean of three independent experiments; bars, SD. (b) Flow cytometric analysis of DR4, DR5, DcR1 and DcR2 expression on the cell surface of lung cancer cells. Shaded peaks represent phycoerythrin‐labeled cells, which shift to the right and indicate death receptor expression on the cell surfaces. Unshaded peaks represent isotype control antibody staining cells.
