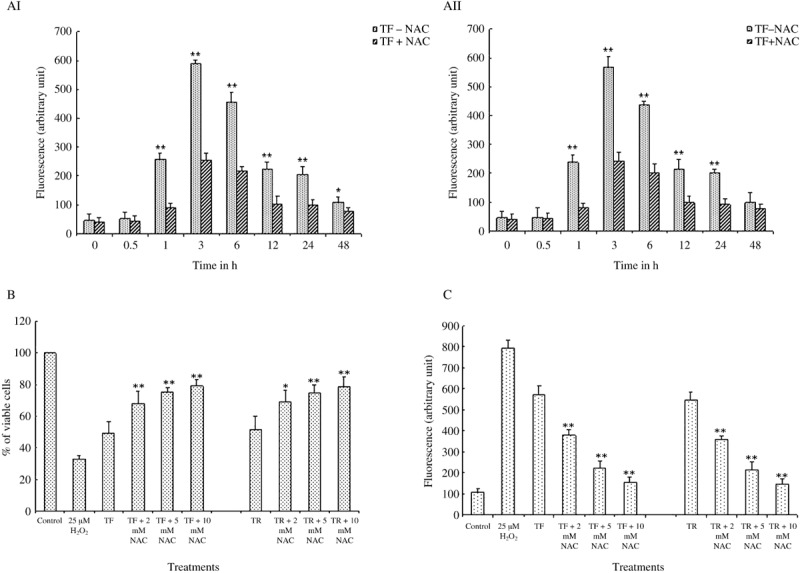
Figure 4.

Effect of theaflavins (TF) and thearubigins (TR) on intracellular reactive oxygen species (ROS) generation, cell viability, and caspase‐3 activity in presence of N‐acetyl cystein (NAC) (ROS inhibitor) in A375 cells. (AI,AII) Time‐dependent effect of (AI) TF and (AII) TR on ROS production in A375 cells in the absence or presence of NAC. NAC was added at 5 mM, 30 min prior to the addition of TF and TR. Then the cells were treated with TF or TR at a concentration of 50 µg/mL for 0, 0.5, 1, 3, 6, 12, 24, and 48 h. Each value is expressed as mean ± SD (n = 3). *P < 0.05 and **P < 0.01 are the TF‐ or TR‐treated groups at 0 h of treatment, as compared with the TF‐ or TR‐treated groups at other time points (0.5, 1, 3, 6, 12, 24, 48 h). (B) Effect of TF and TR on A375 cell viability in the presence of NAC at different concentrations. NAC was added at different concentrations (2, 5, 10 mM) to the cell culture medium 30 min before the addition of TF and TR. Cells were then treated with TF or TR at a concentration of 50 µg/mL for 48 h. Each value is expressed as mean ± SD (n = 3). *P < 0.05 and **P < 0.01 are the TF plus different concentrations of NAC or TR plus different concentrations of NAC groups, compared with TF‐ or TR‐treated groups. (C) Effect of TF and TR on caspase‐3 activity in the presence of NAC at different concentrations. NAC was added at different concentrations (2, 5, 10 mM) to the cell culture medium 30 min before the addition of TF and TR. Then the cells were treated with TF or TR at a concentration of 50 µg/mL for 12 h. Each value is expressed as mean ± SD (n = 3). **P < 0.01 is the TF plus different concentrations of NAC or TR plus different concentrations of NAC groups compared with TF‐ or TR‐treated groups.
