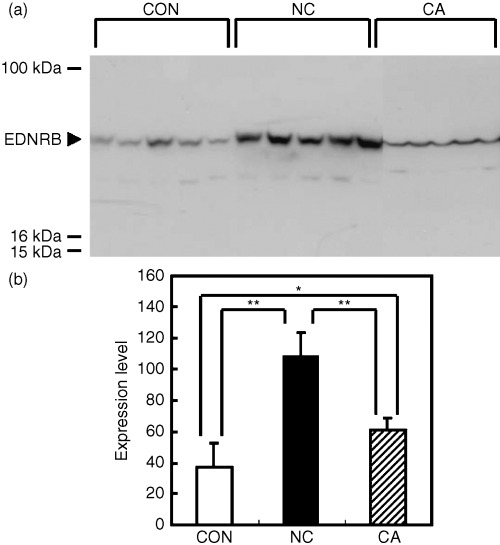
Figure 3.

(a) Expression of endothelin receptor B (EDNRB) detected in rat‐liver samples by western blotting. (b) Protein levels of EDNRB compared between normal liver (CON), surrounding non‐cancerous liver (NC), and HCC sample (CA). Data are expressed as mean ± SD in arbitrary units. There was a significant difference in expression levels among the three groups by anova (P < 0.01). *P < 0.05 and **P < 0.01 by Student–Neuman–Keuls’ test. The indicated data for western blotting are from a single representative experiment that was reproduced three times.
