
Figure 4.
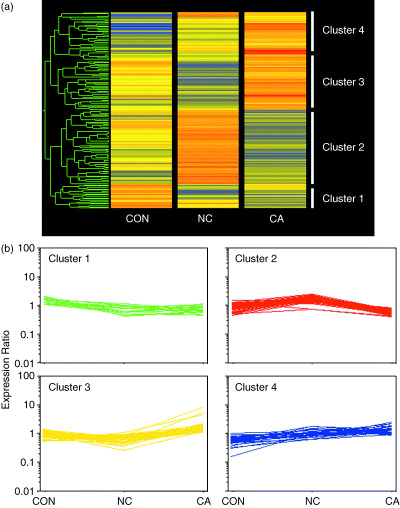
Gene expression profiles among normal liver (CON), surrounding non‐cancerous liver (NC), and HCC samples (CA). One hundred and forty‐six genes were identified as demonstrating differential expressions among the three tissue types and subjected to further analysis. (a) Hierarchical clustering. A dendrogram is shown on the left side of the diagram. Tissue types are represented by columns and genes in rows. Red, yellow and blue represent the higher, equal and lower mRNA levels, respectively, relative to that of the median of each gene. The dendrogram indicates that data are divided along two main branches, each divides further into two branches. (b) Expression patterns of the genes included in the four clusters. The 146 genes were classified by hierarchical and k‐means clustering procedures. Expression ratios of the genes are indicated.