
Figure 2.
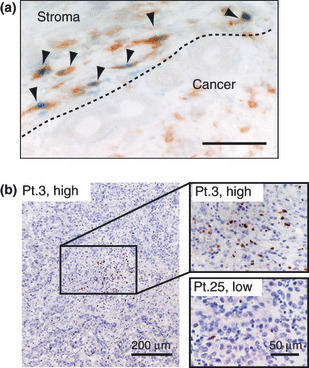
Immunohistochemical analysis of FOXP3‐positive regulatory T cells. (a) Double‐immunostaining of FOXP3 and CD4 antigens. FOXP3 (blue) and CD4 (brown) were stained in the nucleus and cytoplasm of infiltrating leukocytes respectively. Double positive cells are indicated by arrows. Scale bar: 20 μm. (b) FOXP3‐positive cells were counted and classified into two groups (high density or low density).