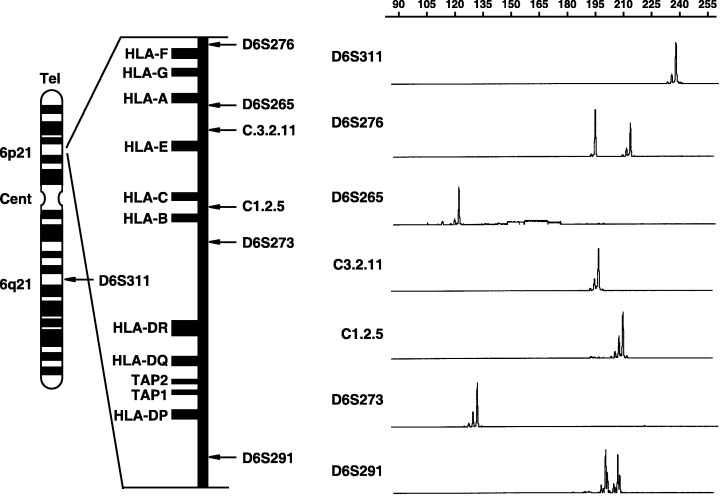
Figure 1.

Schematic presentation of the location of microsatellite (MS) markers on chromosome 6 and GeneScan images of heterozygosity analysis at each MS locus. Positions of MS loci relative to genes within the human leukocyte antigen (HLA) class I/II region also are shown. In GeneScan images, a fragment with two high peaks represents heterozygosity, and one with a single high peak represents homozygosity. The pattern of homozygosity despite use of highly heterologous MS markers strongly suggests that HL‐60 cells have loss of one haplotype of the HLA region. Cent, centromere; Tel., telomere.
