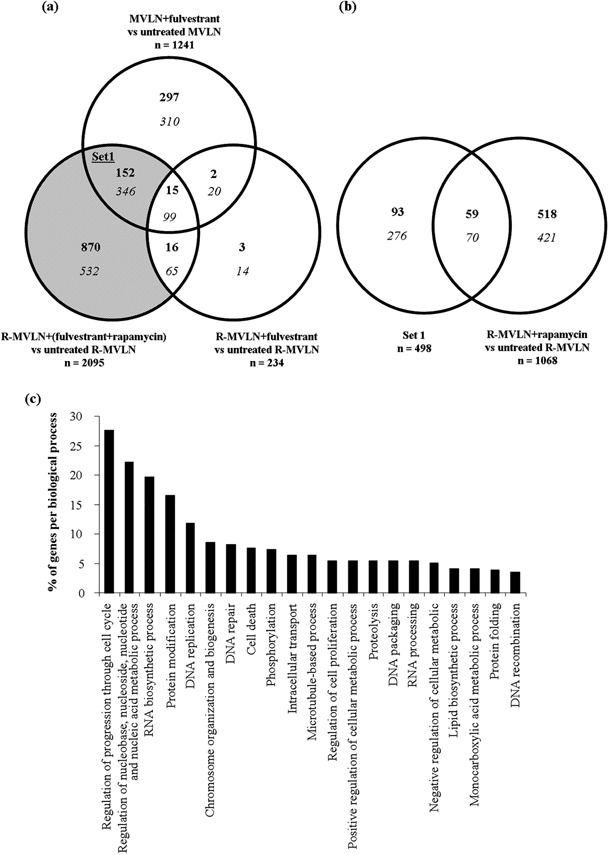
Figure 6.

Reversion of the fulvestrant resistance in resistant MCF‐7‐derived breast cancer (R‐MVLN) cells is associated with specific gene‐expression profiles. (a) Venn diagram showing the distribution of the differentially regulated genes identified in MVLN cells treated with fulvestrant versus untreated cells, R‐MVLN cells treated with fulvestrant versus untreated cells and R‐MVLN cells treated with fulvestrant + rapamycin versus untreated cells. Differentially regulated genes were those whose expression levels were up‐regulated (bold characters) if fold change (FC) > 1.7 or down‐regulated (italic characters) if FC < –1.7. The gray region represents the genes associated with the reversion of fulvestrant resistance by rapamycin in R‐MVLN cells. Set 1 is the set of genes commonly deregulated in MVLN ± fulvestrant and R‐MVLN ± (fulvestrant+rapamycin) but not in R‐MVLN ± fulvestrant. (b) Venn diagram showing the commonly differentially regulated genes between set 1 and R‐MVLN ± rapamycin. (c) Illustration of the most representative gene ontology (GO) biological processes of genes belonging to set 1. Each gene can be a member of more than one GO category.
