
Figure 3.
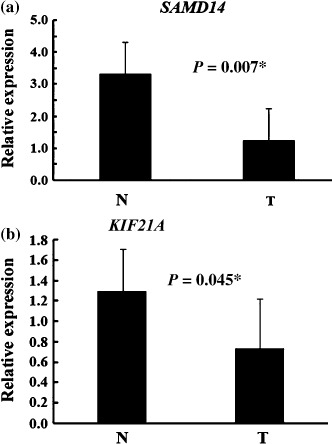
Quantitative real‐time reverse transcription–polymerase chain reaction analysis of the (a) SAMD14 and (b) KIF21A genes in small‐sized human lung adenocarcinomas (T) and human normal lung tissue (N). All measurements are shown relative to the expression level of the glyceraldehyde 3‐phosphate dehydrogenase gene. Bars show means ± SD. *Difference was statistically significant (P < 0.05). (N, 18 cases; T, nine cases).