Figure 4.

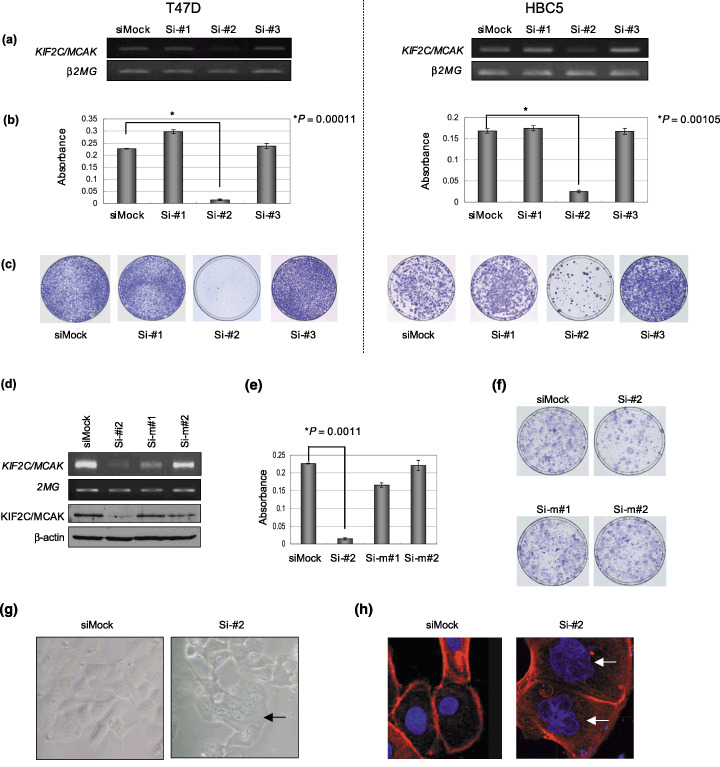
Growth‐inhibitory effects of kinesin family member 2C (KIF2C)/mitotic centromere‐associated kinesin (MCAK) small interfering RNA (siRNA) on breast cancer cells. (a) Semiquantitative reverse transcription–polymerase chain reaction (RT‐PCR) showing suppression of endogenous expression of KIF2C/MCAK by KIF2C/MCAK‐specific siRNA (Si‐#1, Si‐#2, and Si‐#3) in breast cancer cell lines, T47D (left panels), and HBC5 (right panels). Mock‐siRNA (siMock) was used as a control. β2‐Microgloblin (β2MG) was used as a quantitative control for RT‐PCR. (b) The 3‐(4,5‐dimethylthiaxol‐2‐yl)‐2,5‐diphenyltetraozolium bromide (MTT) assay demonstrated a decrease in the numbers of colonies by knockdown of KIF2C/MCAK in T47D (left panel; Si‐#2 P = 0.00011; unpaired t‐test) and HBC5 (right panel; Si‐#2 P = 0.00105; unpaired t‐test) cells. (c) The colony‐formation assay demonstrated a decrease in the numbers of colonies by knockdown of KIF2C/MCAK in T47D (left panels) and HBC5 (right panels) cells. (d) KIF2C/MCAK‐siRNA (Si‐#2) reduced the expression of KIF2C at the transcriptional and protein levels in HBC5 cells, whereas KIF2C/MCAK‐siRNA‐mismatch (Si‐m#1 and Si‐m#2) as well as siMock did not reduce KIF2C/MCAK expression by semiquantitative RT‐PCR (first and second panels) and western blot (third and forth panels) analyses (e) by MTT assay (Si‐#2, P = 0.0011; unpaired t‐test) and (f) by colony‐formation assay. (g) Morphological changes in HBC5 cells transfected with si‐KIF2C/MCAK observed by microscopy. siMock was used as control siRNA. The arrows indicate the midbodies of cells during cytokinesis (right panel). (h) Morphological changes in HBC5 cells transfected with si‐KIF2C/MCAK observed by immunocytochemical staining analysis with 4′,6′‐diamidine‐2′‐phenylindole dihydrochloride (DAPI) and phalloidin to distinguish the nucleus from the cytoplasm. siMock was used as control siRNA. The arrows indicate the multinucleation in KIF2C/MCAK‐depleted cells (right panel).
