Figure 3.
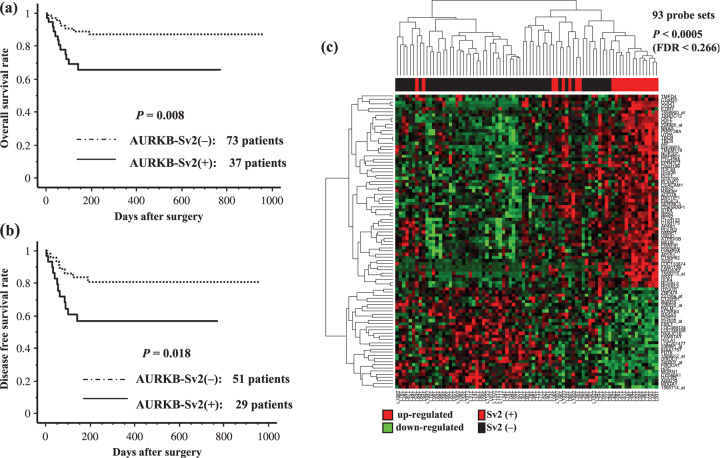
Kaplan‐Meier method analysis survival curves for primary hepatocellular carcinoma (HCC) with Aurora kinase B splicing variant 2 (AURKB‐Sv2) (+/–) cases. Differences were tested for significance using the log‐rank test. All of the microarray‐examined patients with HCC classified into AURKB‐Sv2 (+) group (n = 37, n = 29) and AURKB‐Sv2 (–) group (n = 73, n = 51) after curative resection (P = 0.008) (P = 0.018). (a) Cumulative overall survival curves (110 patients). (b) Disease‐free survival curves (80 patients). (c) Hierarchical clustering of gene expression profiles of selected 93 probe sets obtained from 80 HCC patients: AURKB‐SV2 (+) (denoted as red in vertical side bar), and AURKB‐Sv2 (–) (denoted as black). Dendrograms show the classification determined by hierarchical clustering analysis. Red and green colors indicate relative overexpression and underexpression, respectively.

