
Figure 5.
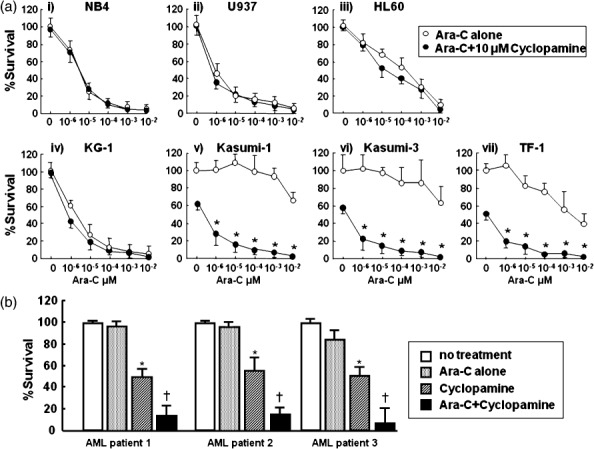
Cytotoxic assay of leukemic cells after exposure to Ara‐C in combination with 10 µM cyclopamine. (A) Survival of leukemic cells was analyzed by mitochondrial conversion of WST‐1 to yellowish formazan. Each cell line was exposed to Ara‐C. The X‐axis indicates dose of Ara‐C (µM) with (d) or without (s) 10 µM cyclopamine, and the Y‐axis indicates percent survival. (i) NB4 (ii) U937 (iii) HL60 (iv) KG1 (v) Kasumi‐1 (vi) Kasumi‐3 (vii) TF‐1. Data represent three independent experiments, each done in triplicate. *P < 0.01, Ara‐C alone vs. Ara‐C+ cyclopamine (Student's t‐test, two‐tailed). (B) Cytotoxic assay of primary leukemic cells. CD34+ leukemic cells were separated and exposed to 10−6 µM Ara‐C and/or 10 µM cyclopamine. Survival of leukemic cells was analyzed by WST‐1 assay. No treatment (open columns), Ara‐C alone (stippled columns), cyclopamine (diagonal columns) and Ara‐C+ cyclopamine (closed columns). *P < 0.05, no treatment vs. Ara‐C alone (Student's t‐test, two‐tailed). † P < 0.05, Ara‐C alone vs. Ara‐C and cyclopamine.