
Figure 2.
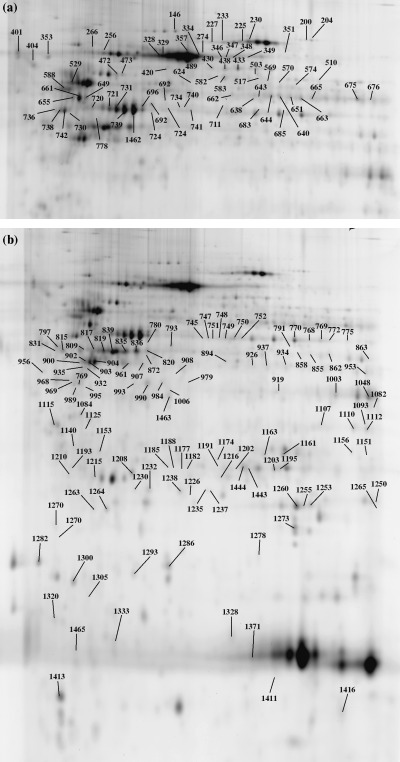
Two‐dimensional map illustrating the spot numbers of identified proteins in (a) the upper gel part and (b) the lower gel part. Spot distribution shows high intensity in the upper part of the master image. Spot numbers (from 1 to 1465) indicate all the proteins identified by mass spectrometry and the numbers refer to those reported in Table S2.