
Figure 4.
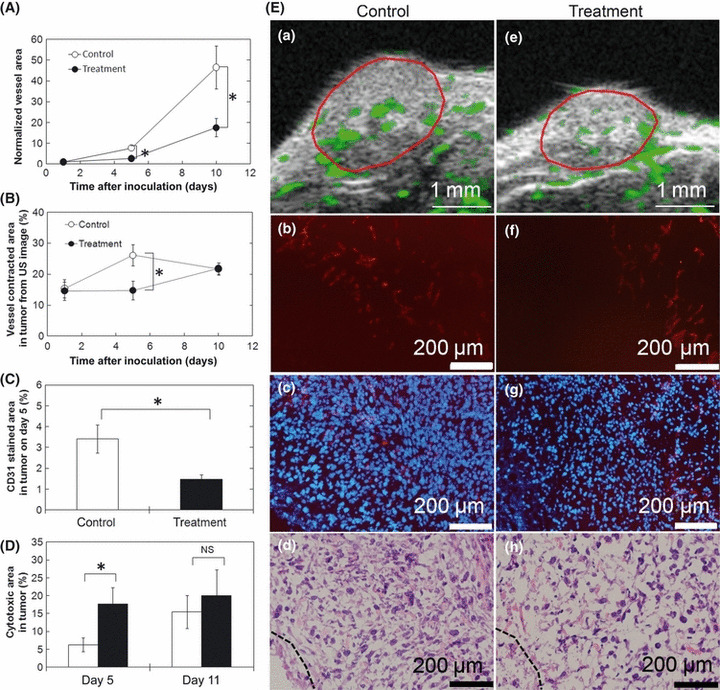
Evaluation of vessel density in tumors. (A) Normalized vessel extracted area in tumors by ultrasound (US) imaging system. Images were acquired on days 1, 5, and 10. n = 6 (six mice) in each group. Vessel area was normalized with that on day 1. (B) Vessel extracted densities in tumors by US imaging system. Images were acquired on days 1, 5, and 10. n = 6 (six mice) in each group. (C) CD31 stained area in tumors. (D) Cytotoxic area in tumors from H&E stained images on day 5 and day 10. (E) Vessel extraction images by the US imaging system (Ea,e, extracted vessels are indicated in green and tumor area are enclosed in red lines); fluorescence images stained with anti‐CD31 (Eb,f, red); merged images of (Eb) and (Ef) with DAPI nuclear staining (Ec,g, CD31 in red and DAPI in blue); and H&E stained images (Ed,h, dashed lines indicate boundaries to obvious cytotoxic area). Plasmid DNA (tumor necrosis factor‐α) was transfected with US and nanobubbles in the treatment group and saline was injected in the control group on days 2, 4, 7, and 9. Tumor samples on day 5 were used for immunohistological analysis (for anti‐CD31 staining; C, Eb–h). Tumor samples on days 5 and 10 were used for H&E staining. Control, n = 7 (four mice); treatment, n = 6 (four mice). Eb (the same section as Ec) and Ed, and Ef (the same section as Eg) and Eh are serial sections. Mean ± SEM. NS, not significant. *P < 0.05.