
Figure 5.
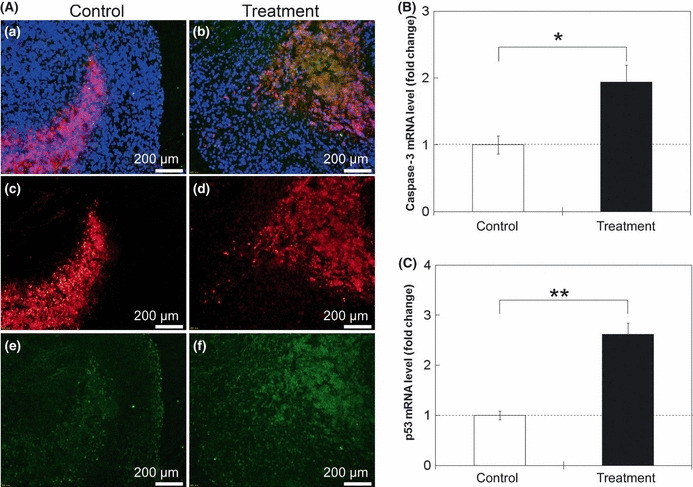
Evaluation of apoptosis and tumor suppressor factors in tumor in response to treatment with tumor necrosis factor‐α (TNF‐α). (A) Fluorescence images. Merged images (Aa,b) of cleaved caspase‐3 (Ac,d, red), p53 images (Ae,f, green), and DAPI (blue). (B) Fold change of caspase‐3 mRNA levels in tumors by quantitative PCR, normalized to the expression of the TFRC housekeeping gene, determined relative to controls. n = 6 (three mice) in each group. (C) Fold change of p53 mRNA levels in tumors by quantitative PCR, normalized to the expression of the TFRC housekeeping gene determined relative to controls. Day 11 tumor samples were used. n = 6 (three mice) in each group. Plasmid DNA (TNF‐α) was transfected with ultrasound and nanobubbles in the treatment group and saline was injected in the control group on days 2, 4, 7, and 9. Mean ± SEM. *P < 0.05; **P < 0.01.