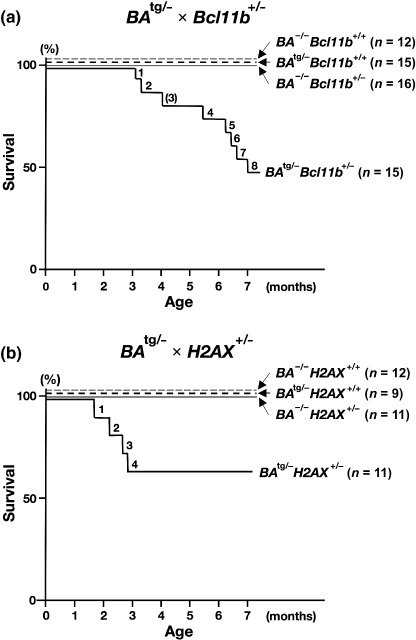
Figure 1.

Survival curves of mice generated by (a) BA tg/– × Bcl11b +/– and (b) BA tg/– × H2AX +/–. The survival curves of BA −/– Bcl11b +/+ and BA −/– HX2A +/+, BA tg/– Bcl11b +/+ and BA tg/– H2AX +/+, BA −/– Bcl11b +/– and BA −/– H2AX +/–, and BA tg/– Bcl11b +/– and BA tg/– H2AX +/– mice are shown as thin dotted, thick dotted, thin continuous, and thick continuous lines respectively. In the BA tg/– × Bcl11b +/– group, 8 of 15 BA tg/– Bcl11b +/– mice died within 7 months of age and in the BA tg/– × H2AX +/– group, 4 of 11 BA tg/– H2AXb +/– died within 3 months of age. The number of an unanalyzable BA tg/– Bcl11b +/– mouse due to death (no. 3) is shown in parentheses.
