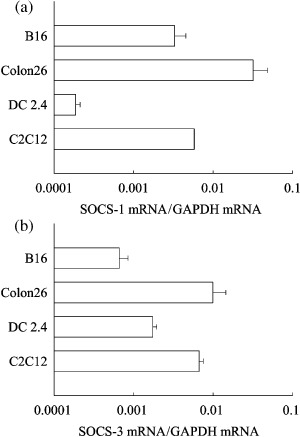
Figure 1.

mRNA expression of SOCS‐1 and SOCS‐3 in murine cell lines. (a) SOCS‐1 and (b) SOCS‐3 mRNA in B16‐BL6, Colon26, DC2.4 or C2C12 cells was determined by quantitative reverse transcription polymerase chain reaction. The results are expressed as the mean ± standard deviation of three independent determinations. GAPDH, glyceraldehyde 3‐phosphate dehydrogenase.
