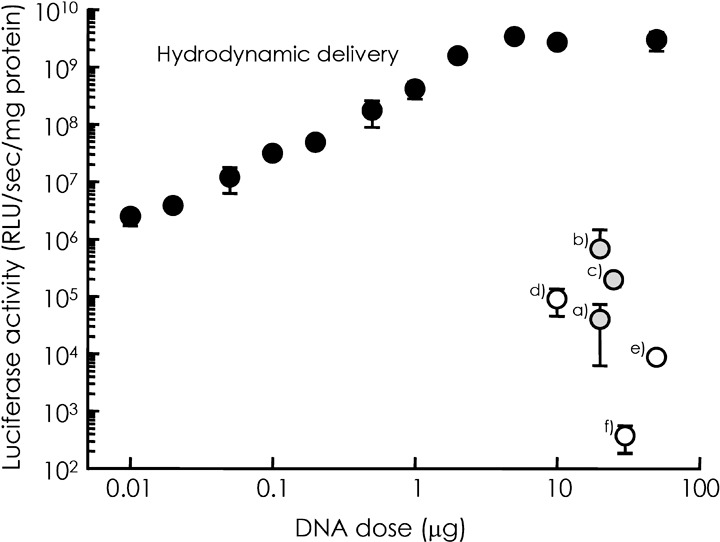
Figure 2.

Comparison of the level of transgene expression by several non‐viral gene transfer methods. Firefly luciferase activity (relative light unit [RLU]/s/mg protein) in the liver after non‐viral gene transfer to mice was plotted against the dose of plasmid vector expressing firefly luciferase (pCMV‐Luc). Closed circles are the results of hydrodynamic delivery of pCMV‐Luc injected at different doses.( 41 ) (a) Direct injection of naked plasmid into the liver.( 17 ) (b) Direct injection of naked plasmid into the liver followed by electroporation.( 17 ) (c) Intravenous injection of naked plasmid followed by electroporation.( 27 ) (d) Intravenous injection of plasmid DNA complexed with galactosylated poly ornithine‐fusogenic peptide.( 51 ) (e) Intraportal injection of plasmid DNA complexed with galactosylated polyethyleneimine.( 54 ) (f) Intraportal injection of plasmid DNA complexed with cationic liposomes.( 52 )
