
Figure 1.
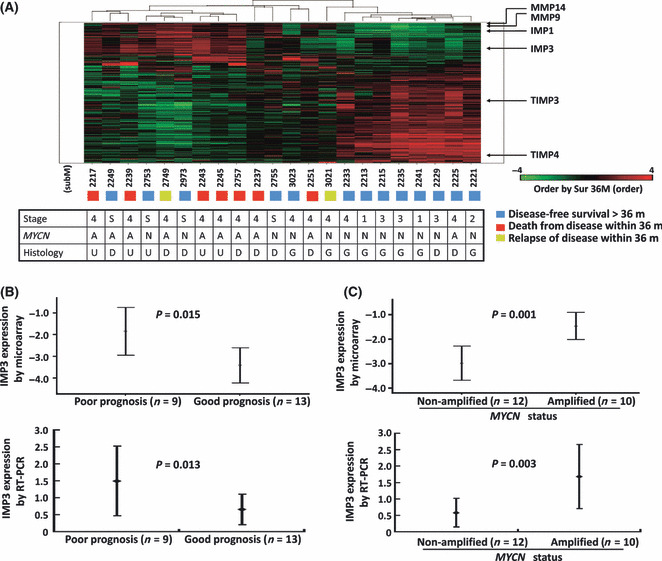
(A) Hierarchical clustering of differentially expressed genes evaluated by oligonucleotide microarray according to patient outcome. The locations of genes in the MMP, TIMP, and IMP families are indicated. A, MYCN amplified; D, differentiating neuroblastoma; G, ganglioneuroblastoma; m, months; N, MYCN not amplified; U, undifferentiated neuroblastoma. (B) Mean IMP3 expression levels with 95% confidence intervals evaluated by oligonucleotide microarray showing that neuroblastoma patients with poor prognosis, defined as dead or disease relapse within 3 years, had significantly higher IMP3 expression levels in tumor tissues than those with good prognosis, defined as disease‐free survival >3 years (P = 0.015, upper panel). The result was reconfirmed in the same 22 patients by quantitative real‐time PCR (P = 0.013, lower panel). (C) Mean IMP3 expression levels with 95% confidence intervals evaluated by oligonucleotide microarray showing that the IMP3 expression level was significantly higher in neuroblastoma tumors with MYCN amplification (n = 10) than in tumors without MYCN amplification (n = 12, P = 0.001, upper panel). The results were confirmed by PCR analysis in the same 22 patients (P = 0.003, lower panel).