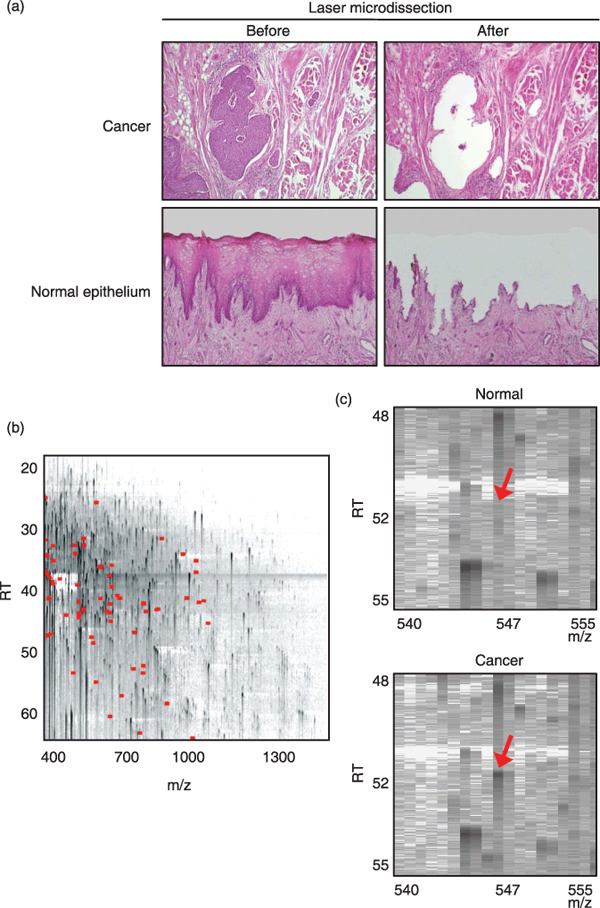
Figure 1.

Identification of proteins differentially expressed in tongue squamous cell carcinoma (TSCC) by 2‐dimensional image‐converted analysis of liquid chromatography and mass spectrometry (2DICAL). (a) Selective removal of cancerous and normal tongue epithelia from formalin‐fixed paraffin‐embedded (FFPE) tissues. The microscopic appearances (HE staining) of cancer (top; magnification, ×100) and normal tongue (bottom; magnification, ×40) tissues before (left) and after (right) laser microdissection are shown. (b) Two‐dimensional display of all (>25 000) MS peaks of a representative sample with the m/z‐values (400–1600 m/z) along the horizontal (x) axis and retention time (RT) (20.0–63.0 min) along the vertical (y) axis. The 72 MS peaks whose average intensity of triplicates differed significantly between cancer and normal epithelia (P < 0.001 [paired t‐test]) are highlighted in red. (c) Close‐up view of a representative MS peak whose intensity differed significantly between normal (top) and cancerous (bottom) epithelia (indicated by red arrows).
