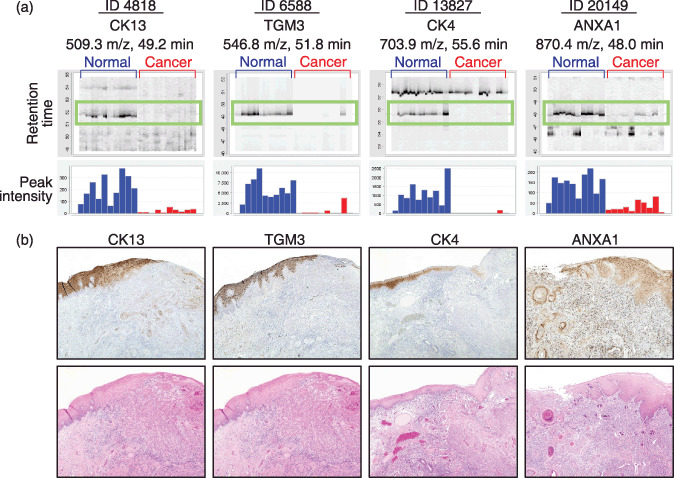
Figure 2.

Identification and validation of differentially expressed proteins. (a) Gel‐like views of MS peaks with retention time (RT) along the vertical axes (top) and distribution of the mean peak intensity of triplicates (bottom) across 20 samples (60 liquid chromatography and mass spectrometry [LC‐MS] runs). Cancer tissues (red) exhibit reduced expression of the four indicated proteins compared with normal epithelia (blue). (b) Immunoperoxidase staining of CK13, TGM3, CK4, and ANXA1 proteins in tongue squamous cell carcinoma (TSCC) (top) (magnification, ×40). Images of corresponding HE‐stained serial sections are shown at the bottom.
