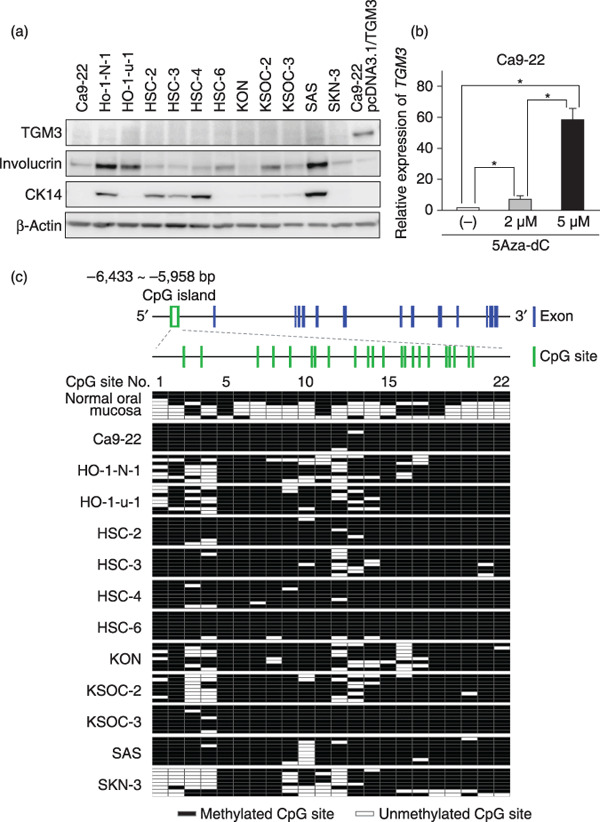
Figure 3.

Epigenetic silencing of transglutaminase 3 (TGM3). (a) TGM3 protein expression in 12 oral squamous cell carcinoma (OSCC) cell lines and Ca9‐22 cells transfected with pcDNA3.1/TGM3 (positive control for TGM3). Total cell lysates (10 µg) were analyzed for expression of the indicated proteins by immunoblotting. Involucrin and CK14 were included as epithelial differentiation markers, and β‐actin as a loading control. (b) Restoration of TGM3 expression by 5‐aza‐2′‐deoxycytidine (5Aza‐dC). Ca9‐22 cells were untreated (–) or treated with 2 or 5 µM 5Aza‐dC for 5 days. Relative expression levels of the TMG3 gene were determined by real‐time RT‐PCR. Columns and bars represent mean ± SD. (c) Cytosine methylation of CpG sites in the upstream region of the TGM3 gene. Exon/intron structure and the CpG island in the upstream region of the TGM3 gene are presented schematically (Top). The 22 CpG sites in the CpG island are numbered 1–22 (middle). Genomic DNA was extracted from normal oral mucosa and OSCC cell lines and treated with sodium bisulfite. Eight independent clones per sample were sequenced (bottom). Clear green box, CpG island; vertical blue bars, exons; vertical green bars, CpG sites; clear squares, unmethylated CpG sites; solid squares, methylated CpG sites.
